Tutorial 4: mouse embryonic (E15.5) brain by MISAR-seq data(Multi-omics Dataset)
the MISAR-seq datasets are available at https://www.ncbi.nlm.nih.gov/geo/query/acc.cgi?acc=GSE213264
Loading and Preparing Data
import pandas as pd
import numpy as np
import scanpy as sc
import anndata as ad
import h5py
import matplotlib.pyplot as plt
from sklearn.metrics import adjusted_rand_score
from sklearn.metrics.cluster import normalized_mutual_info_score as nmi
from SEPAR_model import SEPAR
# Load ATAC data
with h5py.File('dataset/MISAR_seq/MISAR_seq_mouse_E15_brain_ATAC_data.h5', 'r') as f:
    x_atac = np.array(f['X'], dtype='float64')
    loc = np.array(f['pos'], dtype='float64')
    peak_names = np.array(f['peak'], dtype=str)
    Y_atac = np.array(f['Y'])
    cell_atac = np.array(f['cell'], dtype=str)

# Load RNA data
with h5py.File('dataset/MISAR_seq/MISAR_seq_mouse_E15_brain_mRNA_data.h5', 'r') as f:
    x_rna = np.array(f['X'], dtype='float64')
    gene_names = np.array(f['gene'], dtype=str)
    cell_rna = np.array(f['cell'], dtype=str)

# Create AnnData objects
adata_atac = ad.AnnData(
    X=x_atac,
    obs=pd.DataFrame({'cell_ids': cell_atac}),
    var=pd.DataFrame(index=peak_names)
)

adata_rna = ad.AnnData(
    X=x_rna,
    obs=pd.DataFrame({'cell_ids': cell_rna}),
    var=pd.DataFrame(index=gene_names)
)

# Normalize each modality
sc.pp.normalize_total(adata_atac, target_sum=1e4)
sc.pp.log1p(adata_atac)
sc.pp.normalize_total(adata_rna, target_sum=1e4)
sc.pp.log1p(adata_rna)

# Combine modalities
x_combined = np.concatenate((adata_atac.X, adata_rna.X), axis=1)
var_combined = pd.concat([
    adata_atac.var.assign(batch='ATAC'),
    adata_rna.var.assign(batch='RNA')
])

# Create combined AnnData
adata_combined = ad.AnnData(
    X=x_combined,
    obs=adata_atac.obs,
    var=var_combined
)
adata_combined.obsm['spatial'] = loc
Data Preprocessing and Analysis
# Initialize SEPAR
n_cluster = len(np.unique(Y_atac))
separ = SEPAR(adata_combined, n_cluster=n_cluster)
# Preprocess without additional normalization
separ.preprocess(min_cells=50, normalize=False)
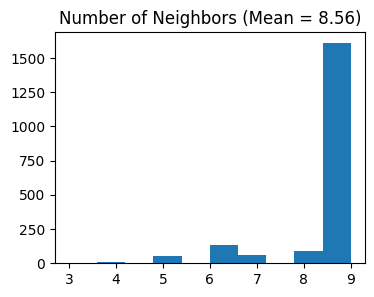
separ.compute_graph(radius_rate=1.3)
# Feature selection
separ.select_morani(nslt=5000)
# Check modality distribution
batch_counts = separ.adata.var['batch'].value_counts()
print("Selected features per modality:", batch_counts)
After filtering: (1949, 49431)
Counting moran's i ...

Finish selecting
Selected features per modality: batch
ATAC    4460
RNA      540
Name: count, dtype: int64
Running SEPAR Algorithm
# Compute weights and run SEPAR
separ.compute_weight(n_cluster=n_cluster)
separ.separ_algorithm(
    r=30,              # Number of patterns
    alpha=0.5,         # Graph regularization
    beta=0.01,         # Sparsity penalty (previously l1)
    gamma=0.5,         # Pattern orthogonality (previously lam)
    mean=False
)
Processing iterations: 100%|██████████| 100/100 [00:36<00:00, 2.72it/s]
Identifying Pattern-Specific Genes/Peaks
pattern_specific_features = separ.identify_pattern_specific_genes(
    n_patterns=30,
    threshold=0.3
)

for i in range(30):
    batch_counts = separ.adata.var['batch'][separ.pattern_specific_mask[i]].value_counts()
# Visualize all spatial patterns
sim_slt = separ.sim_res(separ.Wpn, separ.Hpn, separ.Xt.T)
sim_argsort = np.argsort(-sim_slt)

num_patterns = 30
plt.figure(dpi=100, figsize=(21, 8.5))

for i in range(num_patterns):
    ii = sim_argsort[i]

    # Get pattern-specific features
    pattern_features = separ.pattern_specific_mask[ii]

    # Count genes and peaks
    genes_count = sum(separ.adata.var.loc[pattern_features, 'batch'] == 'RNA')
    peaks_count = sum(separ.adata.var.loc[pattern_features, 'batch'] == 'ATAC')

    # Create subplot
    plt.subplot(3, num_patterns//3, i + 1)
    plt.scatter(separ.loc[:, 0], -separ.loc[:, 1],
                c=separ.Wpn[:, ii].reshape(-1, 1),
                s=2, cmap='Reds')
    plt.axis('off')

    # Add title with both counts
    plt.title(f'Pattern {i + 1}:\n{genes_count} genes\n{peaks_count} peaks',
              fontsize=12)

plt.tight_layout()
plt.show()

# Create and display sorted pattern-specific features table
print("\nTop Pattern-Specific Features (Sorted by Pattern Significance):")
print("-" * 120)
print(f"{'Pattern':11} | {'Significance':11} | {'#Genes':8} | {'#Peaks':8} | {'Top Genes':30} | {'Top Peaks'}")
print("-" * 120)

for rank, pattern_idx in enumerate(sim_argsort[:num_patterns]):
    # Get features for this pattern
    pattern_features = pattern_specific_features[pattern_idx]

    # Separate genes and peaks
    genes = pattern_features[separ.adata.var.loc[pattern_features, 'batch'] == 'RNA']
    peaks = pattern_features[separ.adata.var.loc[pattern_features, 'batch'] == 'ATAC']

    # Format gene string
    if len(genes) == 0:
        gene_str = "None"
    else:
        gene_str = ", ".join(genes[:5])
        if len(genes) > 5:
            gene_str += "..."

    # Format peak string
    if len(peaks) == 0:
        peak_str = "None"
    else:
        peak_str = ", ".join(peaks[:2])
        if len(peaks) > 2:
            peak_str += "..."

    print(f"Pattern {rank+1:<3} | {sim_slt[rank]:.4f}      | {len(genes):<8} | {len(peaks):<8} | {gene_str:<30} | {peak_str}")

print("-" * 120)
Top Pattern-Specific Features (Sorted by Pattern Significance):
------------------------------------------------------------------------------------------------------------------------
Pattern     | Significance | #Genes   | #Peaks   | Top Genes                      | Top Peaks
------------------------------------------------------------------------------------------------------------------------
Pattern 1   | 0.9394      | 397      | 176      | Pfkp, Pkia, Gabrb3, Dock3, Ptprz1... | chr7-45366879-45367379, chr4-134468079-134468579...
Pattern 2   | 0.5582      | 0        | 13       | None                           | chr9-103524894-103525394, chr15-12084121-12084621...
Pattern 3   | 0.4107      | 0        | 22       | None                           | chr3-42892223-42892723, chr12-87043111-87043611...
Pattern 4   | 0.7307      | 0        | 61       | None                           | chr13-9011535-9012035, chr4-7391524-7392024...
Pattern 5   | 0.5459      | 0        | 21       | None                           | chr2-78064389-78064889, chr13-52755821-52756321...
Pattern 6   | 0.4004      | 0        | 3        | None                           | chr2-34938584-34939084, chr2-101762807-101763307...
Pattern 7   | 0.3291      | 78       | 412      | Caly, Vwc2l, Lhx1os, A230006K03Rik, Pcdh17... | chr3-107411651-107412151, chr13-59387863-59388363...
Pattern 8   | 0.6224      | 26       | 282      | Postn, Col6a2, Cd248, Eln, Col8a2... | chr3-37353826-37354326, chr14-23492731-23493231...
Pattern 9   | 0.3357      | 5        | 764      | Arx, Isl1, Lhx6, Slc32a1, Six3 | chr12-52138242-52138742, chr14-22037299-22037799...
Pattern 10  | 0.4824      | 3        | 5        | Tfap2b, Otx2os1, Lef1          | chr9-99876011-99876511, chr5-28165296-28165796...
Pattern 11  | 0.4572      | 0        | 18       | None                           | chr6-84167559-84168059, chr6-84084678-84085178...
Pattern 12  | 0.3531      | 2        | 406      | Col11a1, Alpl                  | chr12-105516927-105517427, chr9-120658538-120659038...
Pattern 13  | 0.4384      | 0        | 5        | None                           | chr3-90586802-90587302, chr12-73012441-73012941...
Pattern 14  | 0.8741      | 1        | 7        | Flnc                           | chr5-107195960-107196460, chr1-64088134-64088634...
Pattern 15  | 0.6902      | 0        | 17       | None                           | chr6-52175885-52176385, chr11-116100408-116100908...
Pattern 16  | 0.3129      | 0        | 4        | None                           | chr1-75786457-75786957, chr2-62339347-62339847...
Pattern 17  | 0.3975      | 2        | 1336     | Neurod6, Neurod2               | chr1-56344926-56345426, chr5-136603153-136603653...
Pattern 18  | 0.4587      | 0        | 16       | None                           | chr1-62416795-62417295, chr7-70330732-70331232...
Pattern 19  | 0.5670      | 24       | 214      | Tnni2, Ckm, Tnnt3, Tnnc2, Actc1... | chr12-109514306-109514806, chr7-29123693-29124193...
Pattern 20  | 0.4523      | 0        | 15       | None                           | chr15-102235302-102235802, chr1-24195773-24196273...
Pattern 21  | 0.3488      | 0        | 13       | None                           | chr2-167565638-167566138, chr4-156059644-156060144...
Pattern 22  | 0.3864      | 0        | 15       | None                           | chr14-121361766-121362266, chr13-63701481-63701981...
Pattern 23  | 0.3038      | 1        | 6        | Cdc20b                         | chr10-3941328-3941828, chr7-80207870-80208370...
Pattern 24  | 0.4127      | 0        | 24       | None                           | chr7-129976043-129976543, chr10-103028446-103028946...
Pattern 25  | 0.3930      | 0        | 14       | None                           | chr7-135999863-136000363, chr7-134549449-134549949...
Pattern 26  | 0.7591      | 0        | 8        | None                           | chr3-133234925-133235425, chr7-83443555-83444055...
Pattern 27  | 0.4272      | 3        | 213      | Kitl, Chst1, Prox1             | chr18-39214938-39215438, chr8-87629747-87630247...
Pattern 28  | 0.3695      | 3        | 953      | Rhbdl3, Mt3, Fabp7             | chr4-21689424-21689924, chr3-5326433-5326933...
Pattern 29  | 0.3513      | 6        | 5        | Ttr, Htr2c, Ptgds, Gm5089, Cd63... | chr1-120602010-120602510, chr4-137375286-137375786...
Pattern 30  | 0.4044      | 2        | 7        | Ccdc162, Abi3bp                | chr9-14921260-14921760, chr4-141337847-141338347...
------------------------------------------------------------------------------------------------------------------------
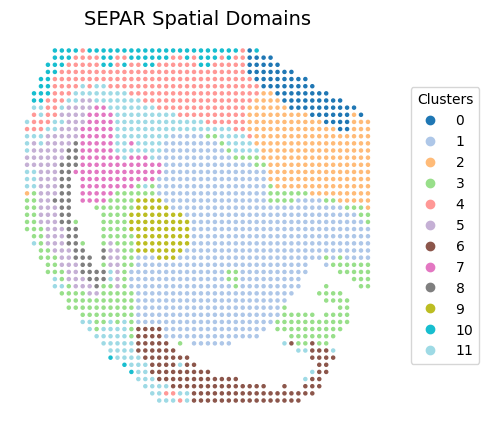
Performing Clustering
# Perform clustering
separ.clustering(n_cluster=12, N1=15, N2=1)

fig, ax = plt.subplots(figsize=(6, 5), dpi=100)
scatter = ax.scatter(separ.loc[:, 0], -separ.loc[:, 1],
                    c=separ.labelres, s=5, cmap='tab20')
plt.title("SEPAR Spatial Domains", fontsize=14)
plt.axis('off')

# Add legend
legend = ax.legend(*scatter.legend_elements(),
                  title="Clusters",
                  bbox_to_anchor=(1.05, 0.5),
                  loc='center left')

plt.subplots_adjust(right=0.75)
plt.show()
Expression refinemnt
adata_refined = separ.get_refined_expression()
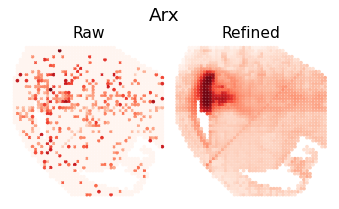
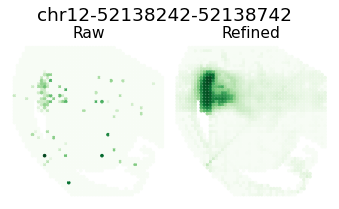
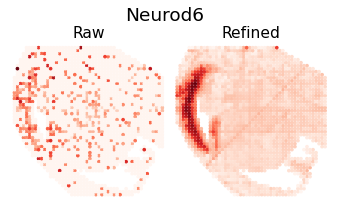
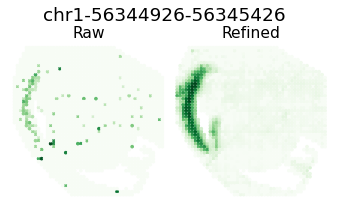
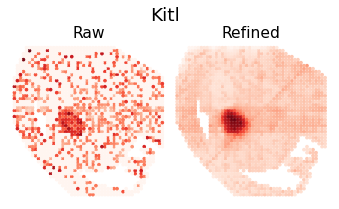
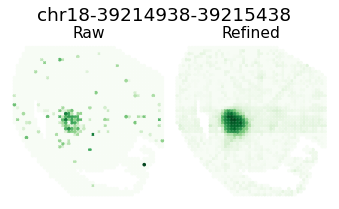
Feature Refinement Visualization
Hp = separ.Hpnn
separ_positions = separ.adata.obsm['spatial']
rna_indices = separ.adata.var['batch'] == 'RNA'
atac_indices = separ.adata.var['batch'] == 'ATAC'
for i in [8,16,18,26]:
    ii = sim_argsort[i]
    h = Hp[ii, :]
    rna_max_value = h[rna_indices].max()
    rna_max_index = np.where(rna_indices)[0][h[rna_indices].argmax()]
    atac_max_value = h[atac_indices].max()
    atac_max_index = np.where(atac_indices)[0][h[atac_indices].argmax()]
    gene_name = separ.adata.var_names[rna_max_index]
    plt.figure(dpi=70, figsize=(6, 3))
    plt.suptitle(f'{gene_name}', fontsize=19, y=1.04)

    plt.subplot(1, 2, 1)
    plt.scatter(separ_positions[:, 0], -separ_positions[:, 1],
                c=separ.adata.X[:, rna_max_index], s=7.3, cmap='Reds')
    plt.axis('off')
    plt.title(f'Raw', fontsize=16, pad = -4)

    plt.subplot(1, 2, 2)
    plt.scatter(separ_positions[:, 0], -separ_positions[:, 1],
                c=adata_refined.X[:, rna_max_index], s=7.3, cmap='Reds')
    plt.axis('off')
    plt.title(f'Refined', fontsize=16, pad = -4)

    plt.subplots_adjust(wspace=0, hspace=0)
    plt.show()

    gene_name = separ.adata.var_names[atac_max_index]
    plt.figure(dpi=70, figsize=(6, 3))
    plt.suptitle(f'{gene_name}', fontsize=19, y=1.04)

    plt.subplot(1, 2, 1)
    plt.scatter(separ_positions[:, 0], -separ_positions[:, 1],
                c=separ.adata.X[:, atac_max_index], s=7.3, cmap='Greens')
    plt.axis('off')
    plt.title(f'Raw', fontsize=16, pad = -4)

    plt.subplot(1, 2, 2)
    plt.scatter(separ_positions[:, 0], -separ_positions[:, 1],
                c=adata_refined.X[:, atac_max_index], s=7.3, cmap='Greens')
    plt.axis('off')
    plt.title(f'Refined', fontsize=16, pad = -4)

    plt.subplots_adjust(wspace=0, hspace=0)
    plt.show()